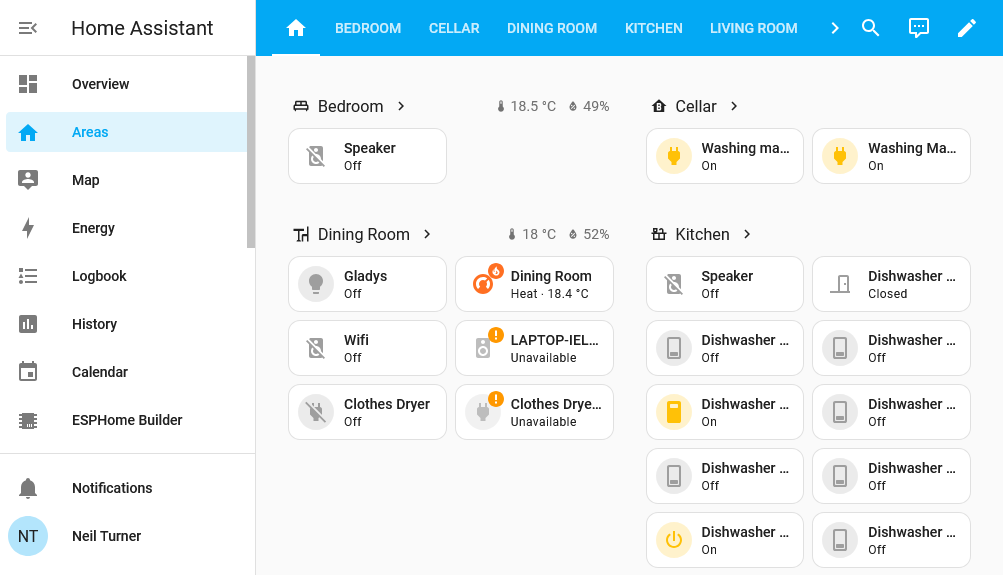
Last week saw the release of Home Assistant 2025.4, and with it, a new type of dashboard called Areas. This is an automatic dashboard, managed by Home Assistant itself, which displays your devices sorted by room, or ‘area’. At present, it’s ‘experimental’, but I wouldn’t be surprised if it becomes the default in future.
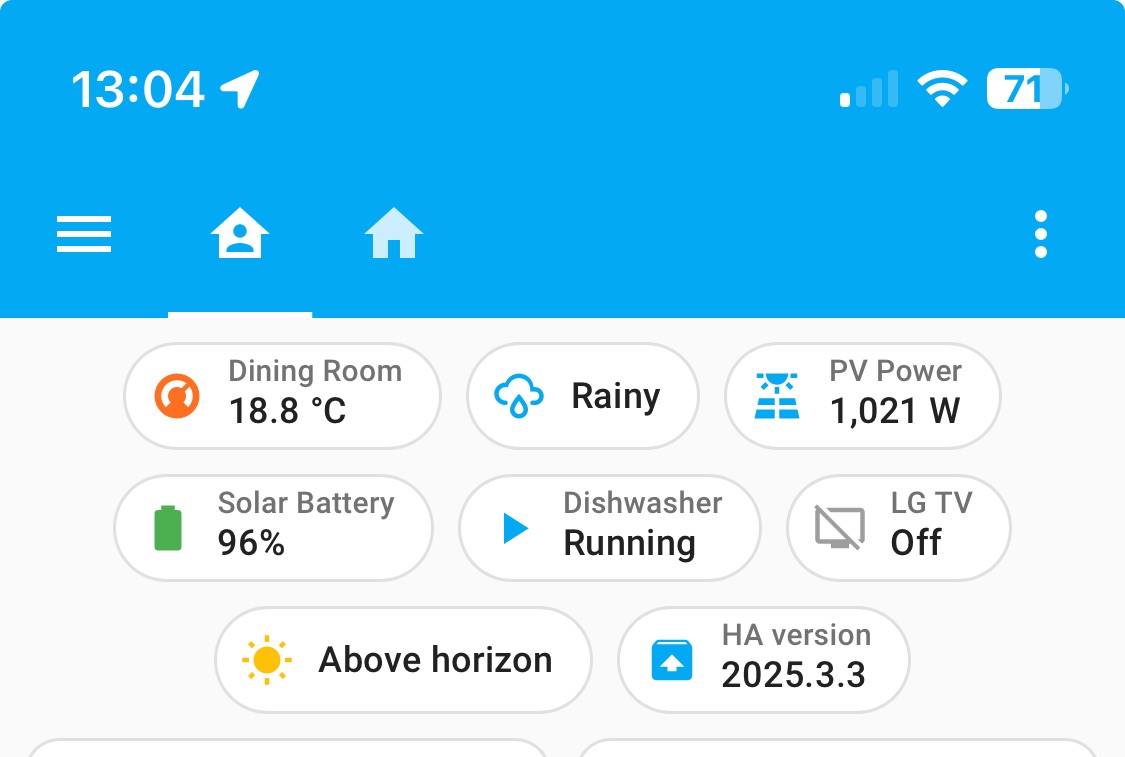
The default dashboard in Home Assistant is also automatically managed, but if you have more than a few devices and integrations, it can quickly become overwhelming. Therefore, my default dashboard is one that I manage myself. I can decide what to show, and in what order. However, it’s taken me quite some time to build and tweak that dashboard, and at one point I had almost 30 different cards showing. I’ve reduced that somewhat, and now use badges to highlight information that I need to know, but it still represents a significant investment of my time.
The new Areas dashboard therefore sits somewhere in the middle. The first tab shows an overview of your home, with sections for each ‘area’ that you have defined in Home Assistant. Most people will make each room an area, but it’s up to you – you may define parts of a room as a distinct area, for example. Personally, I’ve gone down the room = area paradigm, but I also have areas for ‘roof’ (where the solar panels are) and ‘outside’.
Setting up your home’s areas
You can set up your home’s Areas in the Settings pane in Home Assistant. When you do so, you can also specify any entities that represent the temperature and humidity in that room. This is useful, as these entities will then show up on your Areas dashboard.
Once you have defined your areas, you’ll need to add your devices to these areas. Again, in Settings, navigate to the Devices section. You can sort your devices by Area, so you’ll be able to see which ones are not allocated. Some of these ‘devices’ will represent virtual things, like HACS integrations or web services, so you don’t necessarily need to allocate these to a room.

Adding the Areas dashboard
Again in Settings, you’ll need to open the Dashboards pane. Here you’ll typically see three dashboards there already. These will include your current default dashboard, the built-in energy dashboard and the built-in Map dashboard. At the bottom right, click ‘Add Dashboard’, and choose ‘Areas (experimental)’. Give it a title and an icon, and then enable to show in your sidebar. Once done, you’ll be able to access it at any time from the side bar.
Initially, every area that you have defined will have a section and a tab along the top. If you click the Pencil icon at the top right to edit, you can re-order the areas, and also make any invisible. You may want to do this if the dashboard doesn’t show anything useful for that particular area. If you click into each area, you can also hide any devices that you don’t want to see on the dashboard. For example, in my screenshot, each programme on my Bosch dishwasher shows as an individual entity; I can therefore hide all of those apart from the dishwasher’s power status if I want to.
The areas dashboard is still experimental
We’re only a week on from this feature having been made available in Home Assistant, and so it’s still ‘experimental’. In particular, you’ll only see a handful of devices on this dashboard. In my case, this includes lights, sockets, my dishwasher, my TV, media players, and thermostats.
But it’s a lot easier to set up and manage than it would to create a new dashboard from scratch. And it’s less overwhelming than the other default managed dashboard, which shows a huge amount of data. As time goes on, I hope that the Areas dashboard is developed further and becomes the new default. It’ll make Home Assistant feel more like other smart home apps like Google Home, and make it easier for new users to manage.


